Tagged with sparkline
subway sparklines
Posted May 9th, 2009 at 4:18 pm. There are 0 comments.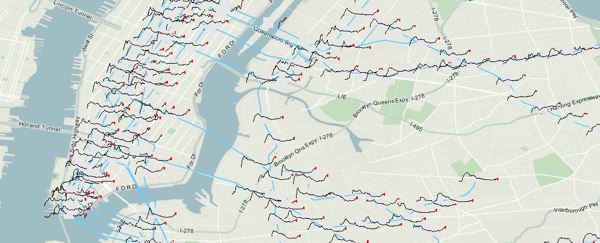
Mike Frumin’s map that show New York City subway ridership between 1905 to 2006 with sparklines for each station. Its great to see sparklines in use on a map, where the detail given by the sparkline is a kind of cartographic detail you can get lost in when looking at a map.
The general idea it that the history of subway ridership tells a story about the history of a neighborhood that is much richer than the overall trend.
[ iamtheweather powered by Wordpress And is definitely Not Plastic Bag ]