Tagged with mapping
Museum of the Phantom City
Posted October 1st, 2009 at 12:26 pm. There are 0 comments.

New York City of today isn’t exactly as we had imagined it. Through history there have been many possible futures that have gone unrealized. The Museum of the Phantom City presents these Architectural and Urban Design proposals as one moves through the city to the intended locations via an iPhone app that is available no in the app store. The Van Alen Institute is holding a walking tour on Sturday October 3rd, the day the full site launches.
Get the Museum of the Phantom City: Other Futures iPhone app
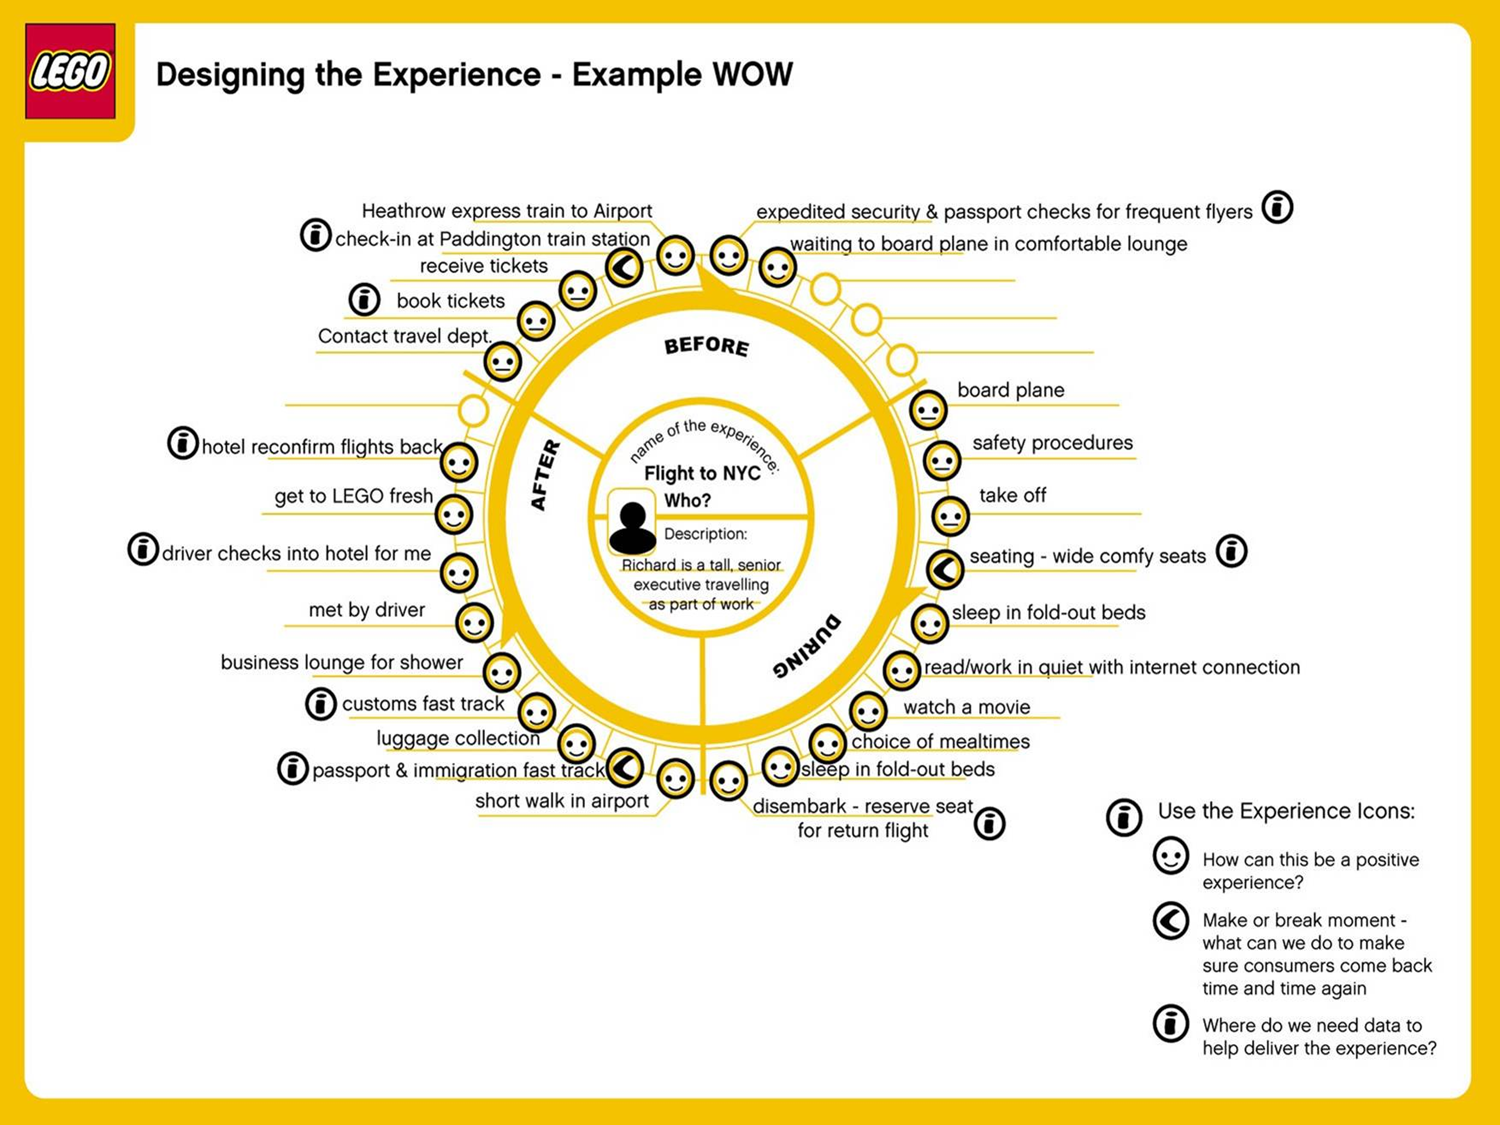
mapping a complete experience
Posted July 7th, 2009 at 11:20 am. There are 0 comments.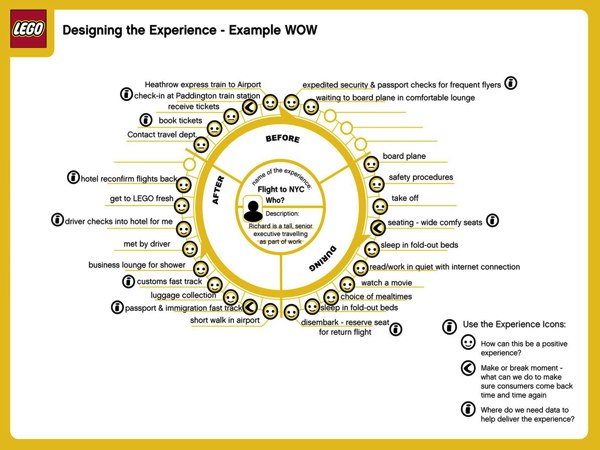
LEGO’s Experience Wheel shows the mapping a complete experience by surfacing the points that are critical to a good experience and where there is opportunity to improve, differentiate or optimize the delivery of the experience, in this case a fictional flight to NYC by a company executive. Bruce Temkin outlines what he like about this particular approach :
- It’s great to have a formal approach to describing/designing experiences
- It starts with the description of a specific customer (in the center)
- It recognizes the life cycle of experiences: before, during, and after
- It’s easy to use and simple to understand
the world as top level domains
Posted May 26th, 2009 at 7:15 pm. There are 0 comments.See a large version, or buy as a poster
map is trademark Byte Level Research
On the Grid
Posted April 30th, 2009 at 7:17 pm. There are 2 comments.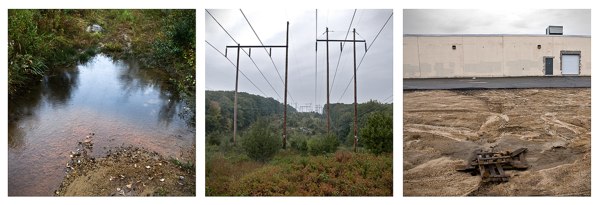
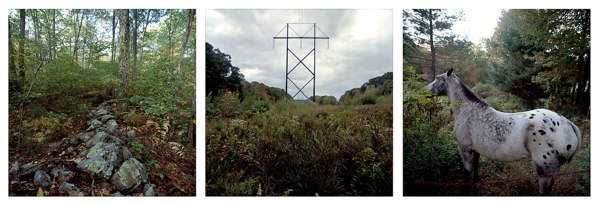
On the Grid is a project documenting the space created by the vast nationwide network of powerlines and the land underneath them. Undeveloped except for the powerlines them selves they carve through the landscape, connected the most rural with the most urban. The shared space, buzzing with the hum of excess electricity, is at times a pristine and beautiful meadow surrounded by forest and others, the uninhabitable tract amongst suburban banality, beautiful in its own right.
On the Grid, a project by Adam Ryder and Brian Rosa, explores the landscape immediately surrounding high-tension electric transmission lines in Rhode Island. Starting near the Ocean State Power facility in Burnllville, Ryder and Rosa spent several days walking along various sites of this arterial infrastructure. Sites were chosen though surveying publicly available aerial photographs and land use maps, and all photos were geotagged with handheld GPS units. In combining the rigid technical process of digital mapping with the subjective practice of landscape photography, this project explores the state as a collection of differentiated spaces that, though seemingly isolated, are networked.
The resulting photographs showcase the topographical diversity surrounding these structures, whose own narrow terrain remains virtually unchanged throughout their straight, incisive paths. The path of the power lines functions as a rural to urban transect, cutting through farmland and commercial parks, cul-de-sacs and strip malls, used car lots and interstate highways.
As human intervention in the natural landscape sprawls to the most remote areas of the state, our lived space becomes increasingly regulated and our encounters with equivocal territories are especially rare. In more urbanized areas, we lose our relation to places which seem to exist unto themselves, where one can feel alone and unhindered. The ambiguity of the land occupied by high-tension power offers the possibility of experience outside of regulation. Despite being part of an infrastructure that is highly regulated and bureaucratized, the physical space inhabited by these power lines remains easily accessible though its sheer ubiquity. Thus, paradoxically, the realm of power lines seems to exist not only outside of regulation, but also outside of the normative properties of the native landscape. Whereas an area half of a mile away from a high tension line may be densely wooded, the space occupied by the wires will be clear-cut, devoid of trees and exhibiting, at most, low shrubbery and grass. The uniformity of this narrow swath as it cuts through the landscape reveals as much about its own spatial utility as it does of the landscape it bifurcates across the state (and beyond). It is this topographical sameness that makes the power lines amazing sites of contrast against both development and the natural landscape.
On the Grid invites reflection on the blurred relationship between networked technology, the built environment and nature through these buzzing monoliths.
– Website Text (An image on the original website)
They did a nice interview on the NPR show Living on Earth (mp3 link).
Quoting here,
Yeah absolutely, it’s a really unique tract of land that doesn’t have any development on it except for itself. So, it’s kind of, in a way its really pristine and untouched and…virginal, its kind of, kind of like, romantic and magical in that way.
-Adam Ryder
and
What’s really – I think actually awesome, is the best word I can use to say it – what’s really awesome about seeing this parade of power lines through the landscape, especially in rural areas is that we’re kind of seeing these, these tendrils connecting humanity as one large organism and it’s a cool way of looking at us, you know what I mean?
-Adam Ryder
Locate powerline grid infrastructure near you via this previous post
gateways to newark by pentagram architects
Posted April 17th, 2009 at 10:52 am. There are 0 comments.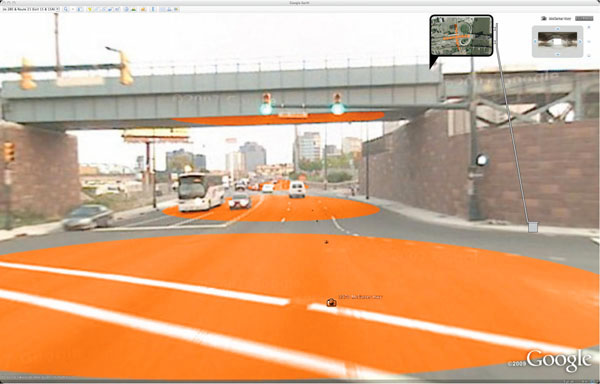
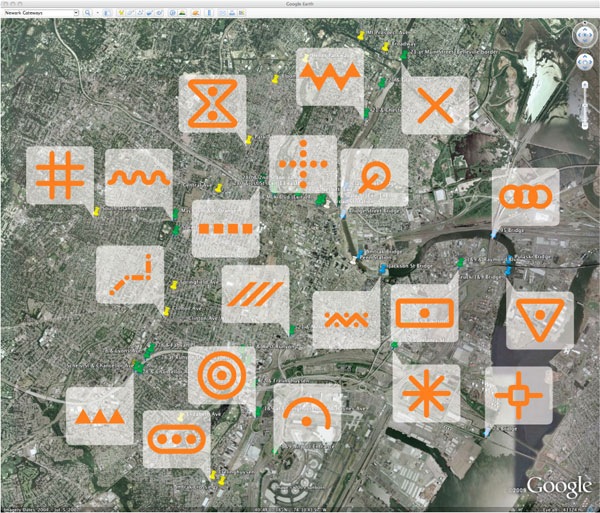
Newark Gateways by Pentagram Architects to create a series of gateways to the city of Newark New Jersey. Painting a series of cartographic type symbols into the Newark streetsccape, in actual physical space, with the intention that they will eventually be incorporated into google earth & google maps satellite views. There are two very interesting ideas at play here – deliberate alteration of the physical environment to affect the display of its digital representation, and the cartographication of the physical space, placing the visual language of representation into the actual.
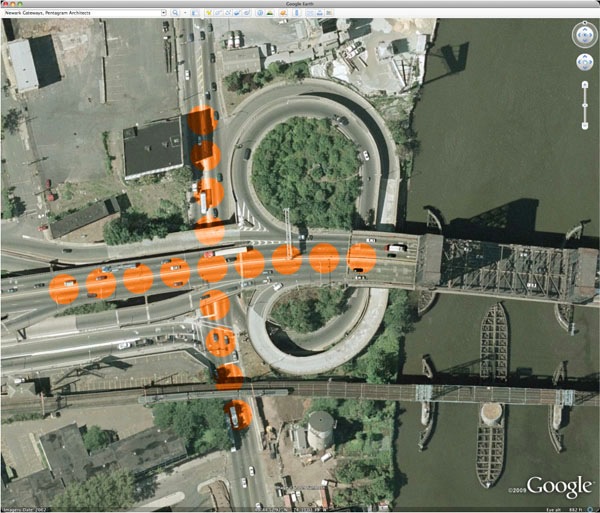
Map symbology has a long and storied history. The process of representing the three-dimensional world as flat and map-like requires a notational language. Our proposal places a new set of distinct symbols “on the map” by creating them for the Google Earth point of view. With paint and little else, Newark can define itself, celebrate its entry points, and address a global audience, all in one stroke. The painted “events” are visible and engaging on Google Earth, while the real locations would be signed with images from above that explain the colors and patterns on the ground.
tokyo jogging
Posted April 15th, 2009 at 12:18 pm. There are 0 comments.
Try to run on the google street view like a jogging game of wii fit from katsuma on Vimeo.
tokyo jogging is a mashup of wiimote and google streetview. Lets you “run” in Tokyo, in your web browser.
The possibilities of this are pretty interesting. Combined with the tv screen on the treadmill or exercise bike at the gym you could run world famous marathon routes and in places where running isn’t usually feasible, say, run the length of the New York Thruway.
via @oliver76
inspiration : data as a seductive material
Posted April 5th, 2009 at 1:17 am. There are 0 comments.Serendipity is looking in a haystack for a needle and finding the farmers daughter
– Julius Comroe Jr.
vehicle motion drawings
Posted February 16th, 2009 at 8:54 pm. There are 0 comments.
Monaco Grand Prix Track Drawing by Tim Knowles
A series of drawings generated by an apparatus in the back of a moving vehicle, a system of sliding rails and elastic holds a pen
on to paper and records the forces at work within the vehicle. As the car moves much like a ball on the back seat of a car,
as you break the pen moves forward, you turn left the pen moves right, etc.
follow the red line navigation
Posted December 19th, 2007 at 9:38 am. There are 0 comments.
Virtual Cable technology that draws route information in an augmented reality display. The 3 dimensional display is created with lasers and mirrors (didn’t fully read that section) and is generated from standard route information output by numerous GPS and SatNav systems available today. The remarkable part about it is the simplicity of the system. “Follow the red line around until we tell you to stop.” The danger may be, as we have seen before, that the information is followed blindly, although keeping ones eyes on the road, and slightly above it, may be better for safety than trying to focus on small map screens, or to decipher the robo-voice directions to bear left in point-five-two miles.
[ iamtheweather powered by Wordpress And is definitely Not Plastic Bag ]